Much economic thought and literature has been published advocating that Skill-Biased Technical Change (SBTC) is amongst the primary reasons for the increases in wage inequality over the last 30 years. The theory advocates that technical change, particularly in the use of computers, acts as a complement to skilled labour whilst also becoming a substitute for unskilled labour.
Theory
(Mostly taken from Borjas, "Labour Economics", 2010)
To fully understand the SBTC framework, we first have to develop an understanding of wage inequality in general. Through using a simple model of labour supply and demand we can illustrate changes in wage inequality which then allows us to explore its causes: 
If we assume r to be the wage ratio of skilled to unskilled workers and p to be the ratio of the number of skilled workers to the number of unskilled workers we can explain the intuition behind the above graph. The demand curve is downward sloping as the lower the gap in the wage ratio between skilled and unskilled workers, the less likely it is that employers would hire skilled workers. If we make the simplistic assumption that the supply of skilled workers is perfectly inelastic, the resulting equilibrium point would be at A.
From this it is evident that the only way that wage inequality can increase is through a reduction in the supply of skilled workers or an increase in demand for skilled workers, which both drive up relative wages. In many developed countries, especially in the US, there has been a sizeable increase in the number of skilled workers, causing the shift from S to S1, and this would imply that the relative wages of skilled workers would have decreased. However, this phenomenon was not to be seen as wage inequality increased significantly during the same period and therefore there must have been other factors responsible. What was actually observed was an increase in the demand for skilled workers which outweighed the increase in supply and therefore caused the wages of skilled workers to rise. This explains why instead of point B being the new equilibrium point on the graph, equilibrium is actually reached at point C.
There have been many attempted explanations for the reasons behind this demand shift including theories looking at supply shifts, international trade and institutional changes in the labour market. Nevertheless, many prominent studies have claimed that Skill-Biased Technological Change is primarily responsible for the increased demand (Bound & Johnson (1992), Bermand, Bound & Griliches (1994) and Davis & Haltiwanger (1991)).
—
Another way to illustrate this effect is through viewing technological progress as making production more efficient and thus, for a given set of resources, increasing production. However, technological improvements can also act as labour saving innovations which enable companies to eliminate low-skilled positions (Siegel, 1999, pp.1). We can further demonstrate this by assuming a production function within which a a technological improvement will shift the function in favour of skilled workers.
As the innovation results in the consolidation of unskilled workers, this will cause their aggregate wages to decrease, subsequently resulting in increased wage inequality as the relative demand for skilled workers will increase.
SBTC Origins
Early Empirics
Key studies into the rise in wage inequality were by Katz and Murphy (1992) and Bound and Johnson (1992), Juhn et al (1993)
Katz and Murphy's (1992) empirical study in the US appeared to show that there was a systematic relative demand shift towards more skilled workers. It appeared that relative demand for labour was rising faster than relative supply, leading to an increase in relative wages..
Bound and Johnson led further study trying to discover why there had been a relative demand shift in favour of more skilled workers. They highlighted SBTC as one of many factors affecting the rise in wage inequality. (Machin 2008 pp10-12)
Back to top
Contemporary SBTC Standing
Whilst early SBTC theory focused on the decline in the demand for unskilled labour as a result of their tasks being replaced by machines, for example on production lines, contemporary revisions have sought to provide a more holistic explanation. As explained by Machin (2008, pp 3) evidence has shown that it was not only the jobs of unskilled workers that were replaced but also the jobs of semi-skilled workers such as bank clerks who performed routine tasks that were replaced by developments such as the increase in ATM machines. These findings suggested that the process resulted in a form of labour market polarisation.
Study into the wage structure has been revitalized in recent times as trends have diverged since the 1980s and those with normally stable wage structures have started to find a rise in wage inequality. Previously the US and UK were the leading culprits showing a large increase in wage inequality however in recent decades trends have shown that wage inequality has been pervasive throughtout many developed countries. (Berman et al 2008 pp 1272-1275)
Evolution of the wage structure in recent years has led to further studies that link the SBTC theory to the increased computer use and demand for skilled workers. This investigation by Autor et al (2007) used regression analysis into computer use and skill upgrading to show that there is a strong positive relationship between skill upgrading and aspects of capital skill complementarity, in particular computers. Nevertheless counterarguments have been developed stating that the use of pencils is also linked to higher earnings. Other variables taken into account during the analysis of changing wage structures are the effects of international trade and the changes in labour market institutions.
Trends
US & UK
Background Statistics
1) Signs of an increase in wage inequality date back to the late 1960s in the US and the late 1970s in the UK.
Fig.1 - Changes in US and UK wage inequality from early studies (from Juhn et al., 1993; Machin, 1996a)

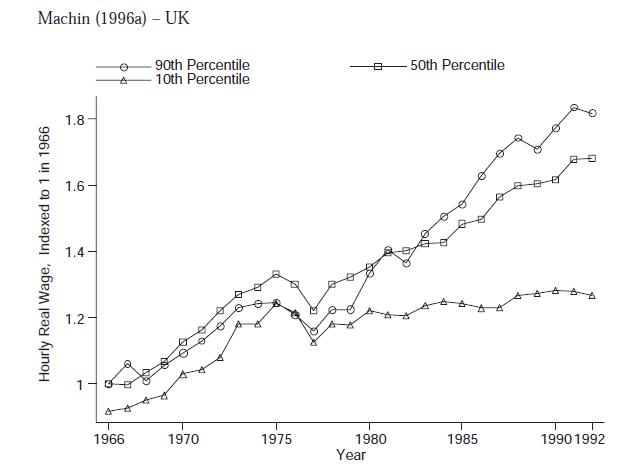
Fig.1 shows that there has been a 'fanning out' of wage distribution over time in both the US and the UK. The 90th percentile has grown faster than the 50th percentile causing the top of the distribution to pull away whilst the bottom has fallen relative to the middle leading to a rise in wage inequality. (Machin, 2008 pp8)
The relative increase in inequality in the UK is further perpetuated by the increase in demand for skilled workers who can operate technology, such as computers. The average growth rate of capital services provided by computers and software between 1979 and 1999 was approximately 30% (Oulton, 2001), and when compared with the 35% percentage increase in the 90-10 ratio of real wages between the period of 1975 and 1995, as highlighted in the Family Expenditure Survey, clearly shows strong positive correlation.
Inequality Trends from the Family Expenditure Survey
Table 1. UK Males - FES real wages
| 10th |
50th |
90th |
90-10 ratio |
|
|---|---|---|---|---|
| 1975 |
3.37 |
5.68 |
9.63 |
2.86 |
| 1985 |
3.46 |
6.64 |
12.26 |
3.55 |
| 1995 |
3.77 |
7.65 |
14.52 |
3.86 |
| %change |
11.9 |
34.7 |
50.8 |
35.0 |
Table 2. UK Females - FES real wages
| 10th |
50th |
90th |
90-10 ratio |
|
|---|---|---|---|---|
| 1975 |
2.21 |
3.61 |
6.42 |
2.01 |
| 1985 |
2.49 |
4.01 |
10.03 |
3.20 |
| 1995 |
2.94 |
5.16 |
10.48 |
3.57 |
This correlation has not only been observed within the UK. There is a strong case that SBTC has been pervasive amongst all developed countries within a similar timeframe (Berman, Bound & Machin, 1998, pp. 1246). The rapid increase in the use of computer technology within the workplace may have had a significant impact upon the structure of wages within industries. Between 1984 and 2003, the percentage of workers who used a computer more than doubled from 25% to 57% in the US (Valletta, 2006, pp. 3) and a similar result was found in the UK. The assumption that computer users earn a premium to those who are non-computer users and that those who use computers are more highly educated (Borjas, 2010, pp. 301), further lends itself to the possibility that there may be some correlation between SBTC and wage inequality.
More Recent Trends
Post 1980s patterns in the wage structure for both the US and UK changed path. In the 1980s wage inequality growth across percentiles was observed to be almost linear. Machin (2008:pp 19-21)highlights three significant differences that can be observed in fig.2
1. 1980s - a higher rise in the educational wage differential than in previous years.
2. 1990s- a rise in the upper tail inequality, but not in the lower tail inequality
3. A Residual ('within-group' inequality) rises throughout.
The UK experienced similar wage and employment trends as the US.
Using information from the US, we see that wage inequality increased rapidly,particularly from the 1980s onwards as shown in Fig 2.
Fig.2 (Source: Autor D., Katz L. and Kearney M 2008)

Rest of the World
The UK and US wage inequality over the past 30 years has been reported much higher than other OECD countries. Whilst wage inequality has risen in UK and US during the 80s continental europe was observed to have a rather stable wage structure particularly that of Italy and Germany.This is thought to be explained by institutional ridgidites and the growing inequality in UK and US being reflected by the unemployment rate in Continental Europe. (Machin 2008 pp17,18) However we can see from table 3 that in the 90s there has been an increase in wage inequality across many countries that were previously characterised with having stable wage structures.
Table 3.
1980-2000 -90-10 Wage Ratios - Male Workers
| Country | 1980 | 1990 | 2000 |
|---|---|---|---|
| Australia | 2.73 | 2.71 | 3.16 |
| Finland | 2.44 | 2.57 | 2.47 |
| France | 3.38 | 3.46 | 3.28 |
| Germany | 2.53 | 2.44 | 2.86 |
| Italy | 2.09 | 2.38 | 2.44 |
| Japan | 2.60 | 2.84 | 2.74 |
| Netherlands | 2.32 | 2.48 | 2.83 |
| New Zealand | 2.72 | 3.08 | 3.55 |
| Sweden | 2.11 | 2.07 | 2.35 |
| UK | 2.63 | 3.24 | 3.40 |
| US | 3.58 | 4.41 | 4.76 |
Source: Adapted from Machin (2007)
Case Study: Germany
Extensive study by Dustmann (2007) shows that Germany is now experiencing the kind of wage distribution that US and UK experienced in the 1980s.
Fig 4. (Source Dustmann 2007)

Dustmanns et al research into the German wage structure challenges the idea that it has a stable wage distribution. The study shows an increase in wage inequality in the 80s predominately through an increase at the top of the distribution. In the 90s we see Germany mimic the rising lower tail inequality which occurred a decade earlier in the US
fig1. This delay is often put down to episodic differences within different contexts. (Dustmann C., Ludsteck J. and Schoenberg U. 2007)
Back to top
Computer Use and the Demand for Skilled Workers
(Mostly taken from Autor et al. "Computing Inequality: Have Computers Changed the Labor Market?" 1997)
History of Computer Use
One of the most notable changes in the modern economy, to that of 50 years ago, is the level of diffusion of computer use throughout the workplace. This change is especially relevant to this theory due to its potential effects on the demand for labour within both industries and firms. Although computer technologies are dated as far back as the 1940s, it was not until the early 1970s that these technologies were implemented, on mass, within the manufacturing and service sectors. This surge in use corresponded directly with the creation of more accessible and practical computers by Apple in the late 1970s and IBM in the late 1980s.
Criteria of Study
Autor, when writing his paper 'Computing Inequality: Have Computers changed the Labor Market?' chose to measure the share of workers who directly use a computer at work in order to analyse the impact of skill-biased technical change on the labour market. Computer use is generally considered to be the use of a microprocessor. Although microprocessors are used in various locations in a workplace, it is difficult to quantify their direct use by the labour force. In order to resolve this difficulty, the percentage share of workers who directly use a keyboard at work will act as a measure for the percentage share of workers who directly use a computer at work in a given firm.
Back to top
Computer Use and Demography

The above table shows the percentage of workers in various categories who directly used a computer at work in the years of 1984, 1989 and 1993.
Over the time period of 1984 to 1993, there were an increasing percentage of both females and males who directly used a computer at work. In more detail, there were a greater percentage of women directly working on a computer than men throughout the time period. In fact, this percentage gap, between the percentages of women and men who used a computer directly at work, had increased from 8 in 1984 (1984 - 29.6% of females and 21.6% of males) to 12.1 in 1993 (1993 - 53.2% of females and 41.1% of males). These results surface the possibility that the reduction in wage inequality between sexes, over the past 30 years, ties directly to the fact that an increasing percentage of women directly use a computer at work, and consequently, earn higher wages.
The second set of data in the table shows the percentage of workers in various levels of education who directly used a computer at work, in the years stated. Only a staggering 5.1% of high school dropouts directly used a computer at work in 1984, and only 10.4% in 1993. These results are diametrically different to those of college graduates. 42.1% of college graduates directly used a computer at work in 1984 and a massive 70.2% in 1993. Therefore in 1993, the difference between the percentages of college graduates and high school dropouts, who directly used a computer at work, was 59.8. It can be argued that the cause of increasing wage inequality, between college graduates and high school dropouts, is because a much greater percentage of college graduates directly use a computer at work compared to high school dropouts.
In 1984, 25.8% of white workers and 18.6% of black workers directly used a computer at work. By comparison, in 1993, 48% of white workers and 36.7% of black workers directly used a computer at work. This data leads to the assumption that; coupled with the impact of discrimination in society, the fact that there are a considerably greater percentage of white workers than black workers, who directly use a computer at work, is a main cause of wage inequality between these two races.
From the graphs, one can see that workers in the age group of 25-54 earn more than workers who are in the age groups of 18-24 and 55-64. This information ties directly to the data, which shows that a greater percentage of workers in the age group of 25-54 directly used a computer at work in 1993 compared to the other age groups. This, accompanied by all the other results in the table, strengthens the theory that wage inequality is directly linked to computer use.

The table above (Makepeace,G. and Dolton,P. 2004), shows the percentage shares of male and female workers who used a computer at work in the years of 1991-2000. The total percentage share of workers who used a computer at work increased over this time period from 60% to 75%, and this is also the case for the percentage shares of both men and women. Consistent with the results from the years of 1984-1993 in the previous table, a lower percentage share of men used a computer at work in the years of 1991-2000 compared to the percentage share of women. The key observation in the panel estimation of the table are the 'changers' (those who change from not using to using a computer at work or vice versa). 19% of the sample changed from not using a computer at work in 1991 to using one in 2000, while the converse applied to only 4% of the sample.
Degree of Computer Use in varying Industries
The level of skill upgrading as a result of a rise in computer use will vary with its application within an industry. The value of the benefits derived from implementing this technology will be judged against the cost of installation, which will lead to a decision as to whether computer technology will be used in an industry .Computer use has been most notable in the industries of legal services, dairy production, advertising and public administration. These industries have seen a large rise in computer use over the past couple of decades. In legal services, dairy production and public administration this has been done to realise the efficiency gains through improved organisation tools available using this technology. Whereas in advertising this technology is used to improve graphical design and imagery in order to convey the desired message. It has been less prevalent in logging, taxicab services, beauty shops, barber shops and bowling alleys. In these industries implementation of computer technology would not be required due to the labour intensive nature of the work, where the use of this technology would not improve the business above the cost of the computers.
Effects of Computer Use on Education
Computer use also has a deeper effect on employment. This is done through the use of computers during education. Holding computer use constant over these 9 years shows a 35% increase in returns to education. The coefficient of education to wage returns is steadily increasing overtime if computer use is held constant.
One example of research into the impact of technology use in education is the 10 year-long Apple Classrooms of Tomorrow (ACOT) research program (Rusten,E.2003,ch4). This project examined the effect that integrating computers into teaching and learning has on student performance. The Apple sponsored study (ACOT 1996) demonstrated that both the behaviour and attendance of the students improved, along with their attitude toward themselves and towards learning. Their performance also showed significant improvement in other areas. Improved test scores indicated that, despite time spent learning to use the technologies, students were performing well and some were clearly performing better than before. The students' writing performance showed more effective expression and was written with greater fluidity. Some classes were able to finish whole units of study far more quickly than in past years. The researchers found that instead of isolating students, access to technology actually encouraged them to collaborate more than in traditional classrooms. Also, instead of becoming monotonous with use, students found technology use even more interesting as time went on.
Independent research into the Apple sponsored project also found that, in addition to improving the results of standardized tests, ACOT students were able to develop a variety of competencies that, although usually not measured, are considered a result of quality education. ACOT students learned to better research and explain information both dynamically and in different forms. The students also became more socially aware and self-confident this allowed them to communicate more effectively about complicated processes. They learnt to use computers routinely and appropriately in various more complex situations, using more advanced programming than that of a standard student of their age. They became self-motivated creating a group of independent learners. The mastering of content was acquired faster than previous, and this was then shared spontaneously with the group, this allowed classes to work collaboratively with less teacher participation. The study was also shown to have developed a positive orientation toward the future for these students.
Computer Use and Skill Upgrading

The, above, regression table further details the degree of the relative complementarity or substitutability of various skill groups with computer technologies. The model presents initial results for the 1979-1993 period. The dependent variable is the annual change in the employment share of each skill group during the time period stated, calculated from the Merged Outgoing Rotation Group (MORG) files of the Current Population Survey (CPS). The independent variable of interest is the annual change in the share of workers who directly used a computer at work in the given industry, calculated from the 1984 and 1993 October Current Population Surveys. The formula of the regression model is shown below:
∆Ej = α + β∆Ci + δxi + ε
where Ejrepresents the employment share of skill group j in industry i, Ci represents the level of computer use in industry i, ε is an error term, and α, β & δ are parameters.
From the data, one can see that the increase in the share of college-educated workers, and the fall in the share of high school-educated workers, was greatest in industries with a rapid rise in computer use.
The data in the parentheses (0.025× 2 < 0.152), on the left-hand part of the regression table, shows that the variables concerning college-educated workers are significant. From 1979 to 1993, the share of college-educated workers rose by 0.36% points per annum in industries with faster growth of computer use. The intercept of this bivariate regression is only 0.028, which would suggest that there would be barely any increase in the share of college-educated workers if the level of computer use was held constant. From these results, one can conclude that the change in the employment share of college-educated workers positively related to a rapid rise in the share of workers who directly use a computer at work. This evidence of unambiguous skill upgrading is further portrayed in the graph below. The graph plots the change in college graduate share in the years of 1973-1993 by the change in computer use in the years of 1984-1993.

From the data of high school-educated workers (0.034 × 2 < |0.301|) in the parentheses, it is evident that its variables are significant. The change in the employment share of high school-educated workers is negatively related to a rapid rise in the share of workers who directly use a computer at work. This negative relationship is depicted in the graph below, which plots the change in high school graduate share in the years of 1973-1993 by the change in computer use in the years of 1984-1993.

Considering the fact that the variables concerning high school dropouts are significant (0.026 x 2 < 0.133), the results in the data for high school dropouts are particularly unexpected. There is a slight increase in the employment share of high school dropouts in an industry with a rapid rise in the share of workers who use a computer at work. This unanticipated relationship can, however, be explained. Initially in the 1970s, high-tech industries employed a very small number of high school dropouts. This, accompanied by the fact that there was a fall in employment levels of these low-skilled workers in basically all industries during the time period, meant that there was only so far that the employment share of high school dropouts could fall considering their employment levels were already at such a low level. In order to try to correct this unexpected result, a control of the average years of education in an industry - measured in 1974 - was included in the right-hand part of the regression table. With the inclusion of this control; in industries with a rapid rise in the share of workers who directly use a computer at work, the relationship with the employment share of high school dropouts is insignificant, while the relationships with the employment shares of college-educated workers and high school-educated workers is still positive and negative respectively. The plausibility of the inclusion of such a control to this regression model is questionable, and therefore, the results without the control are arguably more reliable.

The regression table, above, provides greater detail on the level of skill-upgrading in computer-intensive industries in the last 30 years. The dependent variable is the annual change in the wage-bill share of college-educated workers in the given industry during the periods of 1960-1970, 1970-1980, 1980-1990 and 1990-1996. The independent variable of interest is the change in the share of workers who used a computer in the industry in the years of 1984-1993. The equation of the regression model is shown below:
∆WBit = δt + λt∆Ci+ εit
where WBit represents the wage-bill share of college-educated workers in industry i and time period t, Ci represents the level of computer use in industry i, εit is an error term, and δt & λt are parameters.
The data shows that the increase in the share of workers who used a computer at work in the years of 1984-1993 had a significantly stronger effect on the change in the wage-bill share of college-educated workers in the years following the time period of 1960-1970. During the years of 1979-1993, there was a clear shift in industries with a rapid rise in computerization from service workers to managers and professionals. This all indicates that the level of skill-upgrading was much greater in industries that had a rapid rise in computerization in the years of 1984-1993 compared to less computer-intensive industries.
Computers, Research & Development, Capital Intensity, and Skill Upgrading
(Mostly taken from Autor et al. "Computing Inequality: Have Computers Changed the Labor Market?" 1997)
Criteria Of Study
This section observes whether the positive relationship between rapid growth in computerization and skill upgrading is consistent with wider aspects of capital-skill complementarity, or is specific to just computers.
Back to top
Capital-Skill Complementarity and Skill Upgrading


The regression table above presents data for the time periods of 1960-1970, 1970-1980 and 1980-1990. The dependent variable is the annual change in the wage-bill share of college-educated workers in an industry. The independent variables of interest are the rate of computer investment (OCAM) per worker, the overall changes in capital intensity, and the percentage of the industry's sales that is committed to research and development. The data shows that there are strong positive relationships between all the independent variables with the dependent variable. Therefore, the results indicate that there is a positive relationship between skill-upgrading with wide aspects of capital-skill complementarity (Machin in Gregg and Wadsworth,1999).
Labour Market Polarisation
Polarisation is the next step in a natural progression from the starting point of wage inequality. When the wage inequality gets to such a significant level it leads to the labourers with similar skills, in this case computer or technology skills, getting grouped together at the extremes of the labour market spectrum.Due to the relative increase of skill upgrading within the skilled labour sector, this has naturally led to a "hollow middle" within the labour market. The "hollow middle" labour market now consists of groups with polarised skills and incomes - one with computer skills and the other without. Canada, USA and the UK are solid examples of taking the theory of polarisation and viewing it in the real world environment. Once polarisation is embedded within an economy it becomes very difficult to close that gap and remove this "hollow middle".
.
Fig 5.

Fig 5. shows the "hollowing out" out of the middle of the distribution in both the US and the UK since the 1960s.
(Source: Alderson, A. S., Beckfield, J. and Nielsen, F. 2005.pp412)
Other Variables in the Analysis of Changes in the Wage Structure
Labour Market Institutional Changes
Another suggested influence of rising wage inequality in both the UK and the US is the decline in the importance of Trade Unions. Studies such as those conducted by Card, 1996; DiNardo et al.,1996; Freeman, 1980; Gosling and Machin, 1995) provide evidence for this.
Membership of Trade Unions has declined significantly over the end of the last decade. This means a decline in the effective institutions traditionally renowned for propping up wages of members. Minimum wage would no longer be defended by unions for the low skilled. The weakening bargaining power of unions can be interpreted as an outward shift in the relative demand curve for skilled labour. (Borjas, 2008, pp.302-303).
Institutional changes may also explain the greater rise in wage inequality in the UK and US than in Continental Europe. Institutional structures in Continental Europe created a grounding for wages of unskilled labour, this led to a rise in unemployment rather than wage inequality. (Machin, 2008)
International Trade
Some research has indicated that the internationalization of the US economy plays a role in the increase in the relative demand for skilled workers (Borjas, 2008, p.299). Increases in trade with developing countries has meant US import and export sectors were affected.
Different types of goods are imported than are exported, and subsequently the less skilled workers tend to be employed in import sectors, which are negatively affected by the increase in trade. The better educated workers tend to be found in export sectors, which would flourish in a period of increased trade. In essence, the increased foreign trade therefore meant imports hurt the less skilled, whereas exports help the skilled.
Furthermore, domestic firms, faced with fierce competition from abroad, hired fewer unskilled workers because the goods they used to produce could now be produced overseas at lower costs. The globalization of the US economy can be graphically represented as an outward shift in the relative labour demand curve (Borjas, 2008, p.300). Despite the above arguments, it seems research indicates increased foreign trade contributes modestly to the rise in wage inequality (likely to only account for less than 20%).
Supply Shifts
Shifts in supply of unskilled/skilled workers could also help to explain rising wage inequality. For example the labour market entry of the relatively well-educated baby boom cohort in the 1970's (Borjas, 2008, p.298). Educational composition figures from the 1960's to the 90's reveal a sizeable increase in the relative number of well educated workers in the 1980's-90's. In 1960 the percentage of college graduates was just 10.6%, this had risen to 28.3% by 1996 (Borjas, 2008, p.299). You may expect a large increase in the supply of skilled workers to narrow the wage gap but this was not the case, it still rose. These supply shifts toward a more skilled workforce clearly cannot alone explain the post 1979 rise in wage inequality.
Another example would come from immigration movements of the 1980's, such as the Mariel Boatlift from Cuba. Supply shifts wouldn't necessarily affect wage structures greatly, as long as the immigrants had a similar composition of skills as the natives. Here however, this was not the case and it resulted in a large increase in less skilled workers, which could only exacerbate the wage gap.
Problems with Existing Explanations
There is a great deal of support for Skill-Biased Technological Change as a main reason for rising wage inequality, however the literature implies there is no single cause that can explain the full story. The 'usual suspect's, such as the factors discussed above in this section, often reappear as alternative explanations (Borjas, 2008, p.304). It's usually argued however that the principle cause of shifting demand in favour of skilled labour seems to be related to technology, and other explanations should be considered as supporting actors as their roles in fostering lower wages for unskilled are found to be minimal.
Counterargument to the SBTC Theory
Pencil Theory
A counterargument to the SBTC view is that the use of pencils also seems to be associated with higher earnings. Research conducted into the study of wage inequality established a correlation between the use of computers at work and higher wages. In 1989 a wage differential of 18% was found between those who use computers at work and those who don't. If the gap was interpreted as 'returns to computer use', and it was considered that skilled workers are much more likely to use computers, the information revolution could be a main contributor to the increasing wage gap. Many consider this correlation as evidence to support the theory of SBTC, proving it played an important role in causing the increased inequality found in the US during the 1980's and 90's. (Borjas, 2008). However, there are others who disagree, instead believe the differential could have little to do with the rewards for using a computer at work. They argue that perhaps employers consciously choose the most productive workers to assign computers to. The wage gap is then just measuring the pre-existing productivity differences between two sets of workers, not returns to comp
uter use (Borjas, 2008, p.302).
Other researchers too, have questioned whether the computer effect on wages is fundamentally meaningful in an economic sense. For example, DiNardo and Pischke (1997) wrote a paper entitled 'The Returns to Computer Use Revisited: Have Pencils Changed the Wage Structure Too?' which casts doubt on 'computer use wage differential' as reflecting true returns to computer use or skill. They propose a counterargument to the SBTC view that the use of pencils also seems to be associated with higher earnings, the essence of the counterargument is that the SBTC view is backed by establishing a relationship between the use of technology and higher wages, but you can conduct similar research with different variables, such as pencils and find similar correlations, therefore questioning the validity of the SBTC view.
DiNardo and Pischke used Krueger's (1993) research paper 'How Computers have Changed the Wage Structure: Evidence from Microdata' as a starting point, who found workers who use computers on the job earn 20% more than non-users after controlling for standard worker attributes. They replicated Krueger's analysis using data on German workers. The same techniques were applied to estimate wage differentials associated with several different white collar tools; findings revealed the wage gap was almost as large for them as that recorded for computer use. Therefore, instead of finding further evidence towards a causal effect of computer use on the wage gap, it was concluded the results seemed to suggest computer users may possess unobserved skills which might have a minimal relation to computers but which are rewarded in the labour market, or simply that computers were first introduced into higher paying jobs (DiNardo & Pischke, 1997). The labour markets of US and Germany were sufficiently similar to make them suitable for meaningful comparison, and it was found both basic patterns of on-the-job computer use and the estimated computer wage differentials were very similar in the US and Germany. The raw log wage differential result for Germany in 1985-86 was 0.239, whilst for the US in 1984 it was 0.276. In both countries the wage differential associated with computer use has increased over time, and in 1991-92 Germany's figure increased to 0.288, whilst in 1989 the US reached a differential of 0.325 (DiNardo & Pischke, 1997).
Now we focus on the use of 'pencils', to draw the starkest contrast possible. The literacy rate is 99% in Germany, which implies nearly all workers can use a pencil productively. The tool is not used scarcely, as around 60% of the workforce utilize it in their work, and therefore doesn't proxy for writing skills. You may expect a regression of wages on the use of pencils to therefore yield a coefficient of zero, however this is not the case. Instead a coefficient of 13% is recorded, which DiNardo and Pischke take to imply there is a substantial selection in who is chosen to use office tools, and that selection involves predominantly higher paid workers (DiNardo & Pischke, 1997).
DiNardo and Pischke have discovered workers who use pencils at work earn around 14% more than those who don't. They have shown here that workers who use simple office tools like pencils earn a wage premium similar to that estimated for computer users. From this finding, they question Krueger's diagnosis, arguing the estimated effect of computer use on wages reflects unobserved heterogeneity of skilled workers and their jobs (Chusseau et al, 2008, p.29), such that these workers would earn higher wages even if they did not use computers. In other words, DiNardo and Pischke argue that computer use does not have an independent "causal" impact on wages but instead serves as a mediating or auxiliary factor, reflecting related skills that are more fundamental than the direct ability to use a computer (Valetta & MacDonald, 2004).
Of course, there are limits to their research, some have criticised the study for being conducted only in Germany, and therefore not fully representative. The difficulty of measuring unobserved skills or assets also poses a problem. DiNardo and Pischke didn't set out to disprove the SBTC view though and realise their results are merely suggestive and don't prove whether the computer coefficients represent a return to skills or a selection effect. There is no single theory that can sufficiently explain changes in wage structures, and theorists will continue to battle over the causes, what can be decided upon though is that technology clearly has had a large impact on wage structures, whether is it of a direct or more indirect nature.
Conclusion and Implications of Rising Wage Inequality
In conclusion, many emprical studies support Skill-Biased Technical Change as being a key explanation for increased wage inequality over the past 30 years. However it must also be noted that in this literature, there is no one single factor that can fully explain increased wage inequality. The 'usual suspects', such as increased international competition and trade, trade union decline, and supply shifts, often appear as alternative explanations to SBTC for increased wage inequality (Borjas, 2008). Although there are other reasons behind changing wage structures, Machin argues the principle cause of shifting demand in favour of skilled labour seems to be related to technology, as faster skill upgrading has occurred in more technologically advanced industries (Gregg, 2000), and other explanations should be considered as supporting actors since their roles in fostering lower wages for unskilled workers are found to be minimal (such as the role of developing countries and foreign competition in UK wage inequality (Machin, 2008: 3)). Empirical studies by Autor have clearly shown a positive relationship between skill-upgrading and wide aspects of capital-skill complementarity, in particular growing computerization. This clearly shows that technical change does in fact act as a complement to skilled labour, whilst also becoming a substitute for unskilled labour (Autor et al, 1997).
Studies of technical change on wages and employment must take a long term view due to the nature of the variables required, however much can be taken from the period that this information has been taken from. Demand for more skilled workers has increased more rapidly over the years 1970-95 than at any point during the three decades previous to that. The introduction of computers to the workplace cannot be ignored when viewing this statistic. Indicators of computer use, computer capital per worker and computer investment as a percentage of total investment are much higher in industries with larger accelerations in skill upgrading during the 70s and 80s than in the years previous. Computer technology could explain as much as 30 to 50% of the increase in the rate of growth of the wages for skilled workers since 1970. Although the connections of many of the statistics are uncorrelated this is not to say that they are totally unrelated. It is clear that whatever is driving the increases in rates of growth of demand for skilled labour is definitely concentrated within computer intensive sectors of the economy
The problem of any single reason is the inability to both explain the timing and structure of changes through entire labour market. SBTC struggles to explain the timing of the changes in wage inequality, as the information revolution hit full flow in the 1990's, at which point the increasing wage inequality is seen to slow, suggesting the SBTC theory cannot sufficiently describe the full narrative alone. Furthermore, SBTC theory cannot account for how wage structures have evolved differently in different developed economies, as presumably, SBTC induced by the Information Revolution occurred simultaneously in most of these advanced economies (Borjas: 2008). However, a possible explanation for different wage structures between different countries would instead be the differences in their labour markets, more specifically if they have a culture of safety nets for low skilled workers or not. In a country with a safety net culture the institutional framework would permit wage dispersion to grow and persist, in those without safety net mechanisms that don't allow for wages to change, different trends in unemployment are evident (Ehrenberg & Smith: 2005). A country will either tend to change quantity (employment) or price (wages) in response to increase in relative demand for skilled workers.
Whilst SBTC remains a primary reason favoured by many labour economists for the explanation of rising wage inequality trends, and though it can be concluded to have caused significant growth in upper tail inequality in the UK since the late 1970's, other mechanisms had to be explored to explain the large rise in lower tail inequality in the 1980's and the subsequent bounce back in 2000's (Machin: 2000: 3). Regardless, it is clear technological changes have altered the nature of work, and the way it's rewarded, this appear to be central to the changes in the labour market inequality observed in recent decades (Gregg: 2000). How, when and even if you could 'fix' wage inequality trends is a complex issue, however short-term resolves of reforms of labour market institutions such as trade unions and the support behind minimum wage have been suggested (Machin: 2008: 3). In the long term, a build up of human capital may be required.
.
.
References
Alderson, A. S., Beckfield, J. and Nielsen, F. (2005).'Exactly how has income inequality changed? patterns of distributional change in core societies..International Journal of Comparative Sociology, 46, 405--423
Autor D., Katz L. and Kearney M. (2008) 'Trends in U.S. Wage Inequality: Re-assessing the Revisionists', Review of Economics and Statistics 90: 300-323.
Autor, David H.;Katz Lawrence F. and Krueger Alan B. (1997). "Computing Inequality: Have Computers Changed the Labor Market?".The Quarterly Journal of Economics, Vol. 113, No. 4,
Autor D., Levy F. and Murnane R. (2003) 'The Skill Content of Recent Technological Change: An Empirical Investigation', Quarterly Journal of Economics 118: 1279-1333
Berman. E, Bound. J & Griliches. Z, (1994) "_Changes in the Demand for Skilled Labour within U.S. Manufacturing Industries: Evidence from the Annual Survey of Manufacturing,"_ Quarterly Journal of Economics 109 (May 1994) : pp 367-98
Berman, E.; Bound, J. and Machin, S. (1998) \'Implications of Skills Based Technical Change: International Evidence'; The Quarterly Journal of Economics, Vol. 113, No. 4 (Nov. 1998), pp. 1245-1279: MIT Press
Berman E. and Machin S. (2000) 'Skill-biased Technology Transfer Around the World', Oxford Review of Economic Policy 16(3): 12-22
Bound. G and Johnson. G, (1992) "_Changes in the Structure of Wages in the 1980s: An Evaluation of Alternative Explanations," American Economic Review_ 82 (June 1992): 371-92
Borjas, G. J. (2010) 'Labour Economics', McGraw-Hill: New York, pp. 301
Borjas, G.J. (2008), Labor Economics: Fifth Edition, McGraw-Hill. pp. 87 - 305
Chusseau, Dumont & Hellier (2008) 'Explaining Rising Inequality: Skill- Biased Technical Change and North-South Trade', Journal of Economic Survey, Vol. 22, No. 3, pp. 409-457.
Davis. J and Haltiwanger. J, (1991) "Wage Dispersion between and within US Manufacturing Plants 1963-1986,|http://papers.nber.org/papers/w3722.pdf#anchor]," Brookings Paper on Economic Activity: Microeconomics, pp 115-80" Brookings Paper on Economic Activity: Microeconomics, pp 115-80
DiNardo and Pischke (1997) 'The Returns to Computer Use Revisited: Have Pencils Changed the Wage Structure Too?', The Quarterly Journal of Economics, Vol. 112, No. 1, pp. 291-303.
Dustmann C., Ludsteck J. and Schoenberg U. (2007) 'Revisiting the German Wage Structure', IZA Discussion Paper 2685
Ehrenberg R.G and Smith R.S. (2005), Modern Labor Economics: Theory and Public Policy, 9th Edition. p.489
Goos M. and Manning A. (2007) 'Lousy and Lovely Jobs: The Rising Polarization of Work in Britain', Review of Economics and Statistics 89: 118-133.
Juhn C.,Murphy K. and Pierce B. (1993) 'Wage Inequality and the Rise in Returns to Skill', Journal of Political Economy 101: 401-442
Katz L. and Murphy K. (1992) 'Changes in Relative Wages, 1963-87: Supply and Demand Factors', Quarterly Journal of Economics 107: 35-78
Machin, S. (2008). Big Ideas: Rising Wage Inequality, CentrePiece, Autumn 2008
Machin S. (1996a) 'Wage Inequality in the UK', Oxford Review of Economic Policy 7: 49-62
Machin S. and Van Reenen J. (1998) 'Technology and Changes in Skill Structure: Evidence from Seven OECD Countries', Quarterly Journal of Economics 113: 1215-1244.
Machin, S. (2000), Wage Inequality in the 1970s, 1980s and 1990s, in Gregg and Wadsworth (eds.), The State of Working Britain, Manchester University Press
Machin, Stephen J.,'An Appraisal of Economic Research on Changes in Wage Inequality' LABOUR, Vol. 22, Issue s1, pp. 7-26, June 2008.
Makepeace, Gerald and Dolton, P. (2004) "Computer use and earnings in Britain". The Economic Journal, 114 (494). C117-C129.
Oulton, N. (2001) _'ICT & Productivity Growth in the United Kingdom'; Bank of England
Rusten, E. (2003)."Digital Opportunities for Development: A Sourcebook on ICT Access and Applications", Learn Link,ch4.
Valetta, R. G. (2006) 'Computer Use and the US Wage Distribution: 1984-2003'; Federal Reserve Bank of San Francisco
Valetta & MacDonald (2004) 'The Computer Evolution', Federal Reserve Bank of San Francisco, accessed on 16/11/2009 at http://www.frbsf.org/publications/economics/letter/2004/el2004-19.html
Violante, G.L. "Skill-Biased Technical Change" prepared for The New Palgrave Dictionary of Economics (L. Blume, and S. Durlauf, eds), London, UK:McMillan (forthcoming), available at http://www.econ.nyu.edu/user/violante/Books/sbtc_january16.pdf